The high cost of renewable energy electric conversion systems has been a main hindrance to its development till now. But in order to promote the renewable energy installations, the policies and regulations are being modified in its favor in all major countries. Also, due to the recent advancements in technology and research, the cost of renewable energy electric conversion systems has been continually decreasing with the most significant price drop being observed in solar, which is 80% over the last seven years. Solar energy (especially solar Photovoltaic (PV)) and wind energy are two major sources among the renewable energy resources which have been commercially well-established and are proven technologies for clean electricity generation. By the end of 2015, the global installed capacity of solar PV stood at 227 GW out of 785 GW of total renewable installations. The renewable energy based power generation is growing at a faster pace recently, especially, solar PV. It recorded a huge growth rate of 28% in 2015. The advancements in the field of PV panel manufacturing and the inherent advantages of solar PV over other sources and technologies have paved way for such a tremendous growth. The statistical projections indicate that the global solar PV installations will grow at even faster pace in the coming years. The situation is same in India which has set an ambitious target of 100 GW of solar power by 2022. But these renewable energy resources when implemented in large scale without any specialized controls is found to impact the integrity, reliability and stability of the grid. Solar PV power penetration into the grid is on continuous rise and plants of order of hundreds of MW are coming up in India and at global level. The large upcoming utility scale solar plants are expected to behave similar to the conventional plants and support for managing grid stability. With such an extensive growth in the deployment of the solar PV, power system operators are expected to deal with a new set of issues due to the different nature of the generation. Hence, it is important to study and analyze the impact of the large-scale penetration of solar PV power into the grid.
In this article, the impact of large solar PV penetration on the steady state performance of the grid is discussed. The steady state bus voltages are the main parameters that are affected by the inclusion of the solar PV plants into the system. As a consequence, under-voltages or over-voltages may occur across the system, because voltages may either increase or decrease. This analysis helps in identifying the buses with high or low voltages and the buses with voltages closer to critical levels, thereby, preventive action can be taken. Hence, system reliability and stability can be improved and one can be assured that the system is operating within the permissible voltage limits. The variation in system losses, and real and reactive power loading of transmission lines at various penetration levels have also been examined.
IEEE 9-Bus System – Standard Bus System for Analysis
The IEEE 9-bus test system, which is also known as P.M Anderson 9-bus system, has been modelled in ETAP software. It represents a simple approximation of the Western System Coordinating Council (WSCC) system with 9 buses and 3 generators. Solar PV plant has been integrated into this system. The single-line diagram of the WSCC 9-bus system is as shown in Figure 1. The voltage levels and transmission line impedances are also indicated in the same. This test system also includes 3 two-winding transformers of 100 MVA each, 6 lines and 3 loads (135.532MVA, 94.45MVA, and 102.64 MVA). The base kV levels are 13.8 kV, 16.5 kV, 18 kV, and 230 kV.

Figure 1: IEEE 9 – bus system single line diagram
Developing Model of Solar PV Plant Integrated to IEEE 9-Bus System in ETAP
The complete test bus system has been first constructed in ETAP. Then a model of a typical solar PV plant is developed with the help of PV array block. Many small PV panels of 200 Watt each have been combined in series and parallel combinations to arrive at a PV array with a maximum power of 24.5 MW (MPP power) roughly and a DC bus voltage around 1000V (Vdc). Each of the PV arrays has an inverter unit with an AC rating of 11kV and 26.2 MVA roughly. Several such PV arrays have been created and pooled into a common 11kV bus called solar bus. The output of the solar bus is then given to a station transformer which steps up the 11kV generation voltage to 230kV, which would be suitable for penetration into transmission bus. Initially, this solar plant setup has been integrated into the Bus No. 5 of the IEEE 9-bus system as shown in the Figure 2.
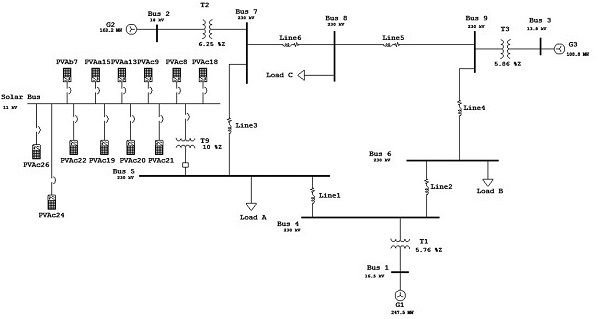
Figure 2. IEEE 9-bus system integrated with Solar PV plant
Steady State Analysis
The IEEE 9-bus system model without solar integration has been considered as the base case with 0% solar penetration. Then solar plant has been integrated into bus-5 first as it has the largest load connected to it. The base case slack bus power (Generator G1) has been taken as reference for the calculation of solar PV penetration percentage. The power injected by solar PV plant into the grid through bus-5 is slowly increased from 0% till around 100% in steps of 10% approximately. Load flow calculation has been performed in each step and various parameters are noted. Steady state power flows in lines, bus voltages, generation details, and system losses were observed. The process is repeated with solar PV integration into other buses namely bus-8 and bus-6.
Effect of Solar PV Penetration on Steady State Voltages
Three different cases of solar PV integration namely penetration at bus-5, bus-6 and bus-8 have been considered for analysis. The bus voltages on all buses in the system have been observed. The complete bus data for all solar PV penetration levels from 0 MW till 243 MW are considered for all three cases. The bus voltages are plotted with respect to the penetration level. The bus voltages of 11kV solar bus is also indicated. Buses 1, 2 and 3 are excluded from the plot as they are constant throughout the penetration. This is because Bus 1 is modelled in swing mode and buses 2 & 3 are modelled in voltage control mode. The plots for all 3 cases are as shown in Figures. 3, 4, and 5.

Figure 3: Plot of bus voltages at various solar penetration levels for case 1 (@ Bus-5)

Figure 4: Plot of bus voltages at various solar penetration levels for case 2 (@ Bus-6)

Figure 5: Plot of bus voltages at various solar penetration levels for case 3 (@Bus-8)
As seen in plots of bus voltages, the voltage profile seemed to be improving initially as the solar penetration is increasing but it starts dropping beyond a certain percentage. Similar trend of voltage variation is observed in all three cases. The voltage starts collapsing as the solar penetration beyond a certain point causes the line drop to increase.
But the intensity of variation in voltages varied with the location of penetration. The maximum of the variation in bus voltages observed in all three cases is listed below,
- Case 1: 2.5% variation of voltage @Bus 5
• Case 2: 3.35% variation of voltage @Bus 4
• Case 3: 8.35% variation of voltage @Bus 5;
The peak point of the curve also varies with the location of penetration. Hence, solar PV penetration into the system can only be allowed up to the point where the voltage profile improves. In case 1 the voltage in most of the buses seemed to be improving till about 30% and after that it collapses. In case 2 the voltage variation is little severe compared to the case 1, where in couple of buses the voltage started crashing right from the beginning. Also in this case at several instances the voltage were close to the under-voltage and over-voltage limits of the system. The case -3 was even severe with almost all bus voltages were starting to collapse right from the beginning and many voltages were close to steady state voltage limits. The variation was also severe compared to the other cases. Hence, it is seen from the study that among the three cases, PV injection at bus 5 was better as it allowed for more penetration with less severe variation in voltages.
Effect on the System Loss
The system losses in both MW (real power) and MVAR (reactive power) have been observed for all penetration levels as done for the voltages and has been plotted as shown in the Figures 6 and 7. Initially, the losses were decreasing till a point and started increasing for the penetration beyond that. In case 1 the losses were decreasing till about 20% and whereas for case 2 it was just about 10%. In case 3, the system losses were increasing right from the beginning. Similar trend was observed in case of the plot of the system losses in terms of reactive power i.e. MVAR. Optimal penetration level with respect to the system losses can be identified from the system loss profile and also the best location for penetration can also be identified from this analysis.

Figure 6: Plot of system losses in MW v/s solar penetration levels for injection at various bus locations

Figure 7: Plot of system losses in MVAR v/s solar penetration levels for injection at various bus locations
Effect on Transmission Line Power Flow
The real and reactive power loading of all the transmission lines existing in the network are observed and plotted for all penetration levels as shown in the Figures 8 and 9. This is observed for case 1. The variation in loading of the transmission lines was mixed with few lines experiencing increase in power and few line experiencing decrease in power. Few of the lines experienced even sign changes in the power flow causing the power reversal beyond a point. The changes in loading of line 1 is severe of all. Thus, it is very important to consider the impact of solar penetration on transmission line loading parameters while planning the network.

Figure 8: Plot of real power in transmission lines at various solar PV penetration levels

Figure 9: Plot of reactive power in transmission lines at various solar PV penetration levels

The summary of the case study is presented in Table 1. Increase in PV penetration can bring variations in steady state bus voltage levels and can be really critical at times and might even contribute to affecting the voltage stability of grid. Also, it might bring about severe changes into other parameters like steady state real power and reactive power loading of transmission lines and other equipment in the system and also affect the system losses. Hence, it is important in performing such a study, which will help engineers in planning the system with high penetration levels of solar PV power and in identifying the critical PV penetration levels for a given network.

If you want to share thoughts or feedback then please leave a comment below.