While conventional coal fired generation is the work horse of the Indian power sector, the future is for the new technology- rooftop solar PV plants and solar concentrator based thermal power plants. Roof tops account for nearly 80% of the solar PV power in Germany and Australia and 50% in USA. Rooftop solar power plants are a typical model of inclusive power development with the participation from the LT and HT end users. There is no upfront requirement for land unlike in large plants, no upfront capital costs to the utility (as the end user would financially participate) and the transmission and distribution losses are negligible since the generation is at a decentralized level. Solar concentrating collectors can boost up the capacity utilization of sugar mill power plants (8-15 MW) by providing steam to the existing turbo generator set up.
In the conventional fossil sector – coal fired generation R&D is required in the area of advanced ultra super critical material development and heat transfer and hydrodynamic design data development through computational or experimental validation.
The future generating sector is likely to be dominated by high efficiency coal based fossil generation using the ultra supercritical and advanced ultra supercritical cycles power on one hand and roof top solar PV based distributed generation and solar concentrator based augmentation of cogenerating plants.
1. POWER SECTOR OUTLOOK
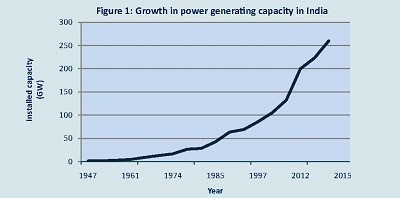
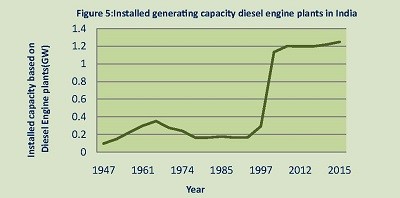
The installed capacity in India which was 1362 MW in 1947 has steadily increased currently to around 275 GW in 2015. The electrical generation has increased from 4 TWh/year in 1947 to 750 TWh/year in 2015 [In comparison, the present US generation is 3,900 TWh/year. During the period 1947 to 2014, the growth rate was 8.5 %. The growth rate of hydro is only 4.4 % while the growth rate of thermal is 11.6 % during this period.
![]()
- APPROACH TO CONVENTIONAL GENERATION
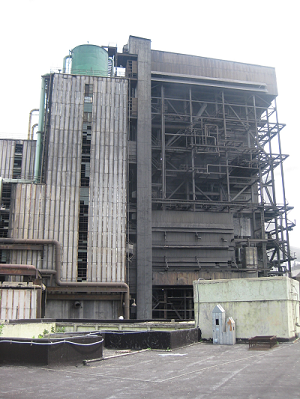
Hitherto, planning focused on installation of coal fired thermal units of 210 MW and 500 MW as the main ingredients of capacity addition. Around 2005 these were replaced to 350 MW and 660 MW units. It is now clear that by this repetitive process we will soon reach the limits of growth and it would be very difficult to sustain growth over 10% (adding around 35 GW/year) by these measures alone. The time has now come to look at the scene with fresh vigour. It is proposed here to discuss some of the ideas for achieving the capacity growth to provide energy security to the Indian power sector.
2.1 Unit size
The most common unit size has been 250 MW and 500 MW, which have around 2005 increased to 300 MW and 660 MW (supercritical) respectively. When individual grids existed and when grid sizes were small, then the maximum size was controlled by the fall in frequency by loss of one of the units on bars. Now, this is not a limitation.
China has been adding approximately 20 GW/year since 1990s which is nearly equivalent of our Plan capacity of 100 GW. They have been installing 3 x 350 MW units at a time.
Russia, the world’s largest supercritical power producer has many pit head (mine-mouth) power stations with unit ratings of 300 MW, 500 MW, 800 MW and 1200 MW. In these plants the steam is not condensed but used for district heating conveying the water/steam at 1350C to distances up to 25 km.
In UK and Japan unit sizes of 400 MW, 600 MW and 800 MW are common.
Turkey has built 1300 MW coal fired units using German technology. The turbine for plant consists of double reheat with one HP cylinder, one IP cylinder and two LP cylinders.
Siemens is offering modular units of 300 MW, 700 MW and 900 MW.
Hence globally, besides units of 660 MW, units of 800 MW and 1200 MW are in vogue. It is time we start opting for either larger sized units or groups of smaller units (such as 500 MW x 3), so that capacity addition can be rapid.
2.2 Technology
The prevalent international combustion technology for coal fired boilers is gas re-burn, staged combustion systems for low NOX burners firing into tangential firing (pulverized fuel) or spiraling fireball (non-pulverized lump/chunk coal) combustors.
On the thermodynamic power cycle side, the standard working fluid of a coal fired is water which operates on the Rankine power generating cycle for most of the existing plants. The common parameters of the main steam entering the steam turbine are 15.0 MPa (150 kgf/cm2) and 5600C. When the main steam parameters exceed the critical point of water (point at which water directly flashes into steam with no latent heat of vaporization), viz., 22.09 MPa (220.9 kgf/cm2) and 374.140C, the operating regime is said to be super critical. Operation below these limits are said to be sub-critical. Plants with operating steam cycle parameters of 31.0-34.5 MPa (310-345 kgf/cm2) and 566/566/566 0C (main steam/1st reheat/2nd reheat) in Benson type once-through circuits are generally referred to as ultra supercritical plants since the operating pressures are 50% higher than the critical pressure of water.. These are the favoured base load and peak load solutions the world over because they are capable of delivering gross overall efficiencies as high as 44-46% (gross unit heat rates of 1869 or better), better load response, low level of make up water requirements, reduced carbon emissions and economic justification over the life cycle of 35 years.
Energy efficient technology will result in reduction in coal consumption of the units.
The various technologies in the horizon are: super critical (SC), ultra super critical (USC) and advanced ultra super critical (A-USC).
Besides the power block, improvement in usage efficiency of coal and ash are possible through:
- On site washing of coals
- Energy generation from rejects for auxiliary steam.
- Total evacuation of fly ash (for cement) and bottom ash (for brick kilns) to ensure water, power and land (pumping of ash slurry to ash pond) is conserved. A case in point is Parli TPS of Mahagenco where total evacuation of ash is being achieved.
The deterioration in coal quality and its continuance over the years is a factor which is burdening the coal logistics. Import to the tune of 15-20% is highly helpful especially when coal prices are high and will continue in the future too.
2.3 Project planning for green field coal based projects
Setting up of bench marking of the project, planning, control and management is required for power projects especially for the coal fired units if we have to ensure a capacity addition of around 35 GW /year as compared to the present 10 GW/year.
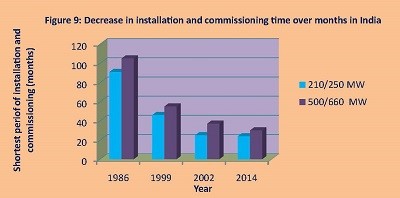
Here, we must congratulate many power projects on breaking thenational record in commissioning of a green field project in an unprecedented record time of below 25 months.
The concepts of project planning, control and management that need to be changed to achieve rapid project implementation are:
- Good vendor development to assess the different technologies, players, etc.
- Single window system of a project manager who reports directly to the CEO thereby cutting across internal protocol.
- Co-ordination for reduced delay due to movement of papers between HQ and site.
- Implementation of different packages through different parties rather than through single EPC (Engineering, Procurement & Construction) contractor.
- Control of project time through advanced management tools for project monitoring.
- Some of the critical issues, which lead to long lead time are:
- Organizing of timely supply and achieving of sufficient indigenous inventory of alloy/stainless/super alloy steels required for manufacture of boiler and turbine components. Here the prior planning process plays a major role in reducing the actual lead time.
- Providing O&M back up support to imported sets of power blocks over the prime life time (25-30 years).
- Making provision for the other critical infrastructure, i.e., supply of waterfrom ground or river source; or its manufacture from sea water conversion, sewage conversion, etc. Next to fuel, water becomes the most critical input and will be even more critical in future.
- Ensuring transmission capacity at the point of injection is ready for power evacuation.
- Ensuring railway operational availability of capacity for transfer of coal from mines/ports. The railway requirements are much more stringent with one 660 MW unit requiring 3 rakes/day against 1 rake/day for a 210 MW unit.
- Ensuring availability of site construction and erection related machinery such as cranes (150 T/350 T), vibration compactors, etc.
- In many of the GENCOs, there is no incentive for early completion. Hence there is no motivation to the supplier/service provider for completion of work before schedule. Introduction of incentives for early completion (0.5 % per week), inspection reports within 7 days, payment within 30 days help in early implementation.
- Common capital infrastructure such as roads that would also benefit other entities as well needs to be created instead of leaving it to the utility in question.
- Minimizing individual time constants like time between synchronization to commissioning reduced from 3 months to within one month.
It is also important that the manufacturing sector must be geared up for manufacturing increased size of individual machines in a unit (boiler portions, turbine blocks, generators, transformers, pumps, pump-motors, fans, blowers, etc.) through capacity addition by up gradation of manufacturing capacity and capability- machine tools; and absorption /assimilation of manufacturing methods, technologies, procedures and design tools for larger machine sizes with automation.
In conclusion a shift in focus from procedure orientation to performance orientation among the employees, organizational structure and financial rules is essential for reducing project down time.
The fundamental criterion of funding for powergen infrastructure is security and adequate return. Both these must be ensured by minimizing risk factors by measures such as:
- Risk sharing must be equitable between the supplier and the power plant owner rather than being heavily weighted towards the supplier.
- Timely sharing of the owner’s infrastructure with the supplier for meeting the deadlines of installation and commissioning.
- Providing far more clarity in the Power Purchase Agreement (PPA) by inclusion of details/scope of risk sharing by each player.
- Sufficiently adequate funding for infrastructure power plant production – for technology absorption, production of quality steels, power plant equipment manufacture for units of higher ratings and newer designs and concepts. Otherwise new technology will be slow in getting adopted into the Indian power sector and will retard the capacity addition growth rate.
R&D is required in the area of new material development and evaluation of their creep rupture, fatigue, thermal stress and properties for A-USC materials typically of ferrous alloy steels, non ferrous nickel based super alloys for boiler and turbine components. Since there is a major initiative to go in for sea water cooling schemes, R & D is required for advanced condenser tube and shell; and cooling water pump materials along with the coatings.
Besides it is required to develop through R&D the design data in the form of heat transfer coefficients, heat flux rates, forced convection flow friction coefficient, hydrodynamic flow patterns through computational or experimental validation of the new configurations involving newer materials and larger unit sizes.
R & D in the area of erosion and corrosion resistant materials is also required to contain the metal loss between capital overhauls and over the life time.
In the absence of cost economic energy storage technology, the dailycycling of thermal sets is going to be a common phenomenon when the penetration of SPV exceeds 30-40% of the total grid capacity, as there will be no margin for managing the load curve. The R & D is also required for development of super alloy steels and non ferrous alloys which can withstand a very large number of cycling operation in a normal lifetime of 35 year or 3 lakh operating hours.
Fuel alternatives to coal
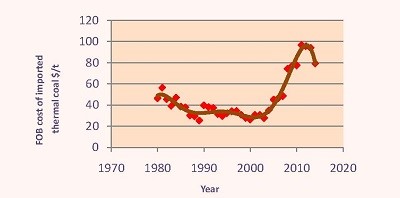
Figure 10 shows the trends in Freight On Board (FOB) cost of imported coals in the international market. A decrease in coal cost is in sight during 2013 and 2014. This can be used to advantage by the Indian power sector as a short term measure.
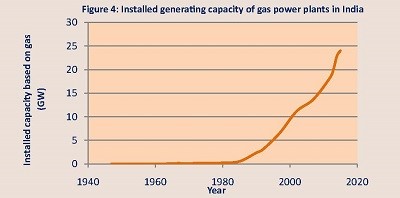
The worldwide use of natural gas has increased in preference to coal and has recorded a consistent CAGR of 9-10% for past 5 years. The same trends are seen in the Indian market and the growth is occurring due to expansion of the power generating sector (through public and private sector routes), deterioration in coal quality and uneven growth in the coal supply sector, which has been the traditional source for power sector growth. Major fraction of the natural gas goes towards power generation. As on date the indigenous production has not been able to keep pace with the growth and increased import of natural gas is inevitable. However, the open market cost of imported gas is going beyond the normal supply-demand dynamics because of the continuously widening market and superiority over coal as an environmentally friendly fuel.
![]()
- RENEWABLE ENERGY
3.1 Solar photovoltaic- the sunrise technology
Solar PhotoVoltaic (SPV) is the most upcoming and promising of the energy resource for a secure power option for India. With 90% crystalline silicon cells (mono and poly) and 10% amorphous silicon (thin film) an annual world capacity addition of 50 GW/year and a total of world capacity of 150 GW, has been achieved. SPV is now accounting for 1% of the world’s power demand. This is because of both the drop in module prices as well as the feed-in tariff mechanisms in place.
The Indian renewable energy capacity is 32 GW which is around 12% of the national installed capacity. Of this, wind accounts for around 22 GW and SPV is 3 GW. SPV accounts for over 25% of the installed capacity in countries like Germany. Both SPV and wind have low project gestation periods as compared to coal fired units and do not need water for the power generation operation.
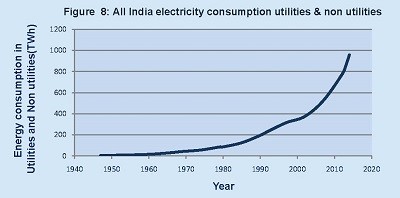
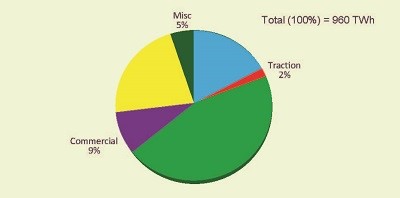
The break up of the electrical energy consumption is given for indicating the trends in usage patterns.
Rooftop systems as the main capacity adding units
The world wide developments have been in two areas:
- Grid connected Roof tops or Green tops
- Grid connected utility SPV plants
While utility SPV plants occupy land, the roof tops use the existing roof top space for installation of systems. The active land use varies between 10 % to 35 % of the total land used for SPV plants and it is highly land intensive. This is overcome by going in for roof tops in the Western countries. Some of the largest roof tops in USA and Europe are of 20-22 MW. A large number roof tops are of capacities above 1 MW. There are also roof tops of 3-5 kW used over cottages. Roof tops account for nearly 80% of the SPV power in Germany and Australia. They account for nearly 35% of the installed capacity in USA. Germany is using a per capita SPV power of 433 W/person and Italy is using a SPV power of 289 W/person. The household penetration rate of SPV in Australia is 25% with average sizes of 4.3 to 5 kW. The world over 69% of all SPV installations are roof tops.
The scenario is contrastingly different in India where the thrust is on installing utility plants. Roof tops have not picked up in India because of three reasons:
- It involves integration at the tail end. This limitation needs to be overcome with the efforts of distribution utilities.
- The clarity on feed-in tariff needs to be generated and the feed in tariff must be sufficiently incentive for users to invest into roof tops.
- Technology demonstration is generally in low key.
If we take the roof top areas of major cities like Delhi, Kolkata, Chennai, Bengaluru, Hyderabad, etc., 10% of the residential roof top area is sufficient to meet the city’s total power requirements. If the focus is shifted on roof tops in another 2-3 year time roof tops will be able to add significant capacity to the grid. The roof top system is well suited to Indian conditions especially in the rural areas with weak utility grids.
3.2 Solar concentrator based power for biomass based co-generation-another sunrise technology
Solar thermal concentrating collectors have come of age and the solar concentrator based power generation is now a viable option in some of the hot and dry weather zones. Concentrating Solar Thermal (CST) plants blend well with already existing power cycles using water as the working fluid such as Combined Heat And Power (CHP) plants and bagasse based cogeneration. While integrating concentrating collectors with bagasse based plants there is no need for installation of the turbo-generator and other power block components as they are already present in the plant. The output of the concentrating collectors can directly be integrated into the exit of the bagasse based boilers. Therefore, it will lead to considerable cost reduction in integrating the technologies.
The PLFs of CHP plants (30 to 70%) are not comparable to that of utility plants (which are in the range of 80+ %) because of the seasonal nature or demand based production of the former and also the consideration that power is a by-product (secondary derivative) and not the only end goal. Nevertheless they are preferred because of their low carbon foot print and low specific pollutant generation rates. Though the tapped potential for CHP is rather low there is good untapped potential for CHP in India of around 42 GW. Hospitable environments such as open access, obligatory renewable tariff, tradable performance, etc., will help in unlocking of the untapped potential. The outlook for CHP in the Indian horizon is quite bright in the near future.
While the utility power sector is almost exclusively based on power only generation, the presently tapped potential for cogeneration from sugar plants is very low (1.7 GW).
There is good untapped potential of around 8 GW from the sugar sector itself. Bagasse based cogeneration in sugar projects is an area of prime potential in terms of automation and technology up gradation.
The optimal level of turbo-generator size is 8+ MW per 1000 tcd (tonnes crushing per day) capacity, which is ideal for energy efficient cogeneration projects. This is in contrast with present values of 3-5 MW per 1000 tcd in most sugar mills. For optimal efficiency and heat rate in sugar plants, both internal steam and electric demands have to be minimized to very low levels by energy efficiency measures. Present in-house auxiliary steam and power levels are unusually high in most sugar processes.
The use of high pressure boilers (> 11 MPa and 550 °C) and 3-d stage optimized steam turbines will ensure low heat rate and maximum energy efficiency of the process besides reducing the specific water consumption of the process. Sugar process and power block automation enhance energy efficiency through reduced auxiliary steam and increased turbo-generator efficiency.
3.3 Hybrid power plants
The policy for stand alone (off grid) and grid connected hybrid power plants- roof tops (wind-solar pv), diesel replacement for telecom (wind-solar pv), biomass-solar pv, solar pv-gas turbine, wind-gas turbine is not available. Encouragement for hybrid power plants could reduce the dependence on cycling of thermal sets which could happen due to use of SPV.
3.4 Strengthening of the state level renewable energy development agencies
Many of the state level renewable energy development agencies with the exception of a few are acutely understaffed and have a shortage of skilled manpower with skillsets in the area of understanding of tenders, technology and implementation. Many staff are deputed from the power departments of the distribution sectors where the skill sets are entirely different. A review and audit of the skillsets and induction of trained manpower or training of existing manpower can reduce the lead time and enhance the efficiency of renewable penetration projects in the various states.
Concluding remarks
The future generating sector is likely to be dominated by coal based fossil generation using the ultra supercritical and advanced ultra supercritical cycles power on one hand and roof top solar PV based distributed generation and solar concentrator based augmentation of cogenerating plants.
To achieve the capacity addition envisaged targets a multi-pronged integrated approach is required with intensified investment in the following areas:
- Fossil generation: Ultra supercritical and advanced ultra super critical coal based generation.
- Fossil mix: Combination of coal and gas based generation.
- Renewable: Solar roof tops & solar concentrator based co-generation for increasing the load factor for bagasse based sugar mills.
In the traditional coal fired sector, a deviation in the traditional thinking of putting up of 350 MW and 660 MW plants is called for. Rapid capacity addition is possible by increase of unit size to 800-1200 MW and by going in for ultra and advanced ultra supercritical plants.
CPRI as the R&D organization under the Ministry of Power, Govt. of India, is gearing up to meet all challenges in providing support in the transition to new technology and processes through testing and evaluation; inspection and R&D.

If you want to share thoughts or feedback on this article, please leave a comment below.