Government of India has a vision of developing 100 smart cities across the country aiming at higher economic growth and improved quality of life.
Smart cities are considered to build a strong and intelligent infrastructure with sustainable environment. The core infrastructure elements expected out of a smart city would include 24×7 water and power supply, robust transport system, efficient water & waste management system, reliable IT network, smart buildings, state-of-the-art health care & education facilities, e-Governance, safety & security, etc. It is evident that to build these infrastructure elements efficiently, electricity plays a vital role. It would be impossible to build an efficient infrastructure without reliable energy source.
To ensure 24×7 reliable and energy efficient power to the smart city, it is imperative that the electric services should be of best quality, continuous and economic. Thus, the most significant and crucial design goals would be optimal demand assessment followed by establishment of an efficient power distribution system. For building a new smart city, accurate prediction of the demand is a challenging task due to the diversified and varying pattern of the load. This requires a holistic approach through a diversified and optimized load model.
Demand Estimation
Usually for a city development, historical and statistical load pattern and recorded load data will be used to estimate the maximum demand.
This normally includes monthly energy billing data for domestic consumers and hourly meter recordings of the maximum demand values for bigger customers, generally HT consumers.
Development of a new smart city which aims at high reliability necessitates an advanced model. Generally, the models adopted till date in many countries are, objective based models, identification based models on spatial coverage, classification based modeling approach. In a smart city, more focused demand estimation is required in order to meet the criteria of optimal, energy efficient and economic demand estimation.
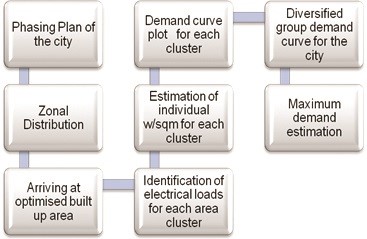
Figure 1: Stages of Demand Estimation
As per UN estimate, cities are responsible for 75% of global primary energy and contribute to 70% of global carbon emissions. The situation in Indian cities is still severe, the energy demand is rising each year, according to British Petroleum’s energy forecast, energy demand in India is expected to increase by 132% by 2035 while the growth in production will be about 112%. Thus, to build a smart city, it is vital that low carbon foot print and energy efficient power should be considered as major factors.
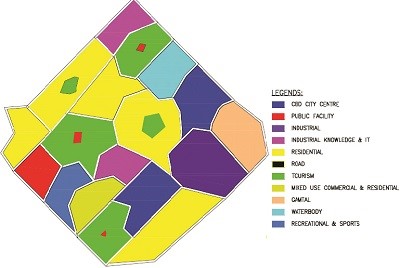
Figure 2: Typical Zonal Classification
To enhance the sustainability and energy security of the city and to ensure that the city remains an attractive destination for investment, renewable energy becomes a significant component of energy mix. It is crucial to supplement energy produced by burning fossil fuels with clean renewable energy.
In addition, demand should meet the different types of load clusters with varying load pattern. Electrical load varies with time, place and climate. Therefore, a diversified demand estimation using weighted arithmetic mean model is considered. This model involves series of strategic planning and scrupulous forecasting of load demand. The various steps involved in this model are depicted in Figure 1.
a)Phasing Plan and Zonal Distribution of the City
Based on the city developmental plan and with consideration of environmental and sustainability objectives, zonal classification is done. Generally in any smart city, different types of zonal plot areas are envisaged. Few typical classifications are: Residential, High Access Corridor, City Center, Industrial, Knowledge & IT., Commercial, Recreation, Sports & Entertainment, Utilities, Public Facility Zone, etc. A typical zonal classification for a city is depicted in Figure 2.
b)Built-up Area Estimation
The optimized built-up area for each type of land use and plot area is derived based on resident population, floor space index norms, urban and regional developmental plan formulations and guidelines (UDPFI) and National Building Code (NBC). The built-up area considering growth plans & population density of various clusters are used in the assessment of the power demand and infrastructure planning of electrical power system.
c)Identification of Electrical Loads for Each Cluster
The electric loads are influenced by various factors i.e., application factor, area classification factor, climatic factor and time factor. Considering these factors, broad load classification are worked out which are further framed into micro level classifications. Various typical loads envisaged are lighting & receptacles, air conditioning & ventilation, workstations & servers, electronic appliances, elevators & escalators, heaters, water treatment loads, sewage treatment loads, etc.
d)Estimation of Individual Watt/Sq.m for Each Cluster
Precise estimation of Watt/Sq.m of individual loads is carried out considering the important objective of load optimization. Being a smart city, energy efficient, renewable energy source and adoption of smart & advanced technologies are the key factors which influence the load estimation. Optimum estimation on Watt/load is worked out considering the following energy conservation aspects adopted in a smart city.
- All commercial (IT/office) buildings are LEED certified
• Energy efficient lighting system for commercial buildings, street lighting and common area lighting
• Energy conservation measures in HVAC design
• Smart & Intelligent lighting controls for all road lighting
• All motors employed in utility area (WTP, STP, ETP, pumping stations, gas & fire stations, etc.) and industries are energy efficient motors.
• Usage of Variable Frequency Drives (VFD) for process motors
• Smart homes with smart metering system
• Integrated, smart and intelligent power system automation for complete city
• Renewable energy source like solar for all commercial and official buildings
In a typical city, major energy contributors are residential sector, industries and commercial buildings which require substantial consideration of energy efficient measures.
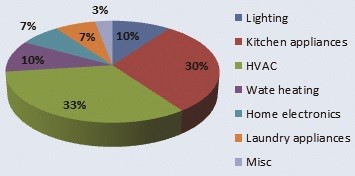
Residential Zone: Various surveys conducted across Indian cities reveal that residential sector contributes around 25% of the total power consumption. Major loads which contribute to this includes lighting, kitchen appliances, air conditioners and space heating. Typical energy usage pattern of residential loads are depicted in Figure 3.
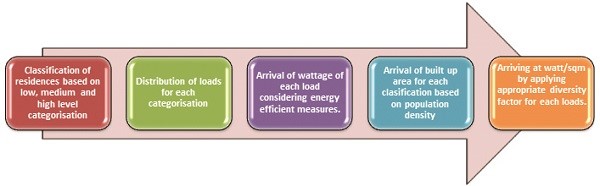
Due to the significant proportion of energy consumption of residential sector, optimum energy demand estimation should necessarily take into consideration the various energy conservation measures. In general, residential energy pattern is influenced by variant factors such as number of occupants, time of occupancy, occupant behaviour and standard of appliances used. There are various models used for residential demand estimation such as statistical model, top down approach, bottom up approach, etc. The methodology adopted in this context is bottom up engineering approach which is based on end use energy model and this model has an advantage of identifying potential energy efficient measures. The major steps involved in this approach is depicted in Figure 4.
Commercial Buildings: Predominant loads envisaged in this zone are lighting (interior and exterior), HVAC, workstations and datacenters. Similar to residential, bottom up engineering end use model is adopted where Watt/Sq.m is arrived considering the energy wattage of individual end use load with due consideration of energy efficient measures.
As per ASHRAE standard, the lighting power density using building area method for office buildings is 0.9. However, in smart city, considering energy efficient measures such as efficient lighting, efficient lighting controls, the value is further optimised to less than 0.9. In a smart city, most of the official and IT buildings are expected to be LEED certified. Therefore, as per LEED norms, minimum of 3-5% renewable energy source is considered while arriving at the respective building Watt/Sq.m. While arriving at Watt/Sq.m, diversity factor plays a significant role as in commercial buildings, the power consumption varies with occupancy of the building and the work profile of the building.
Industrial Zone: Contribution of industrial zone is equally substantial and more complex to estimate the load. Due to varying industry types with diversified and unique load pattern, statistical energy data approach is considered in this zone.
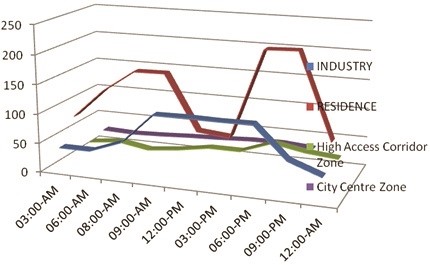
Figure 5: Typical Hourly Energy Demand Curve
e)Watt/Sq.m for Mixed Type Plot
In a smart city, normally a mixed type of plot is envisaged. In a mixed type of plot, identifying the exact load model to be adopted is complicated. For example, residential zone comprises residences, commercial offices/retail, leisure/hospitality, community facilities, local public open space, roads & utilities. Standard Watt/Sq.m model cannot be applied for this plot type. Thus, average load is worked out for these types of plots by applying a Weighted Arithmetic Mean (WAM) model by determining the percentage of different mix available.
Table 1. Weighted Arithmetic Mean
Model Of A Typical Residential Area
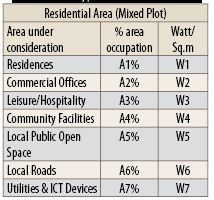
Uniform Watt/Sq.m by means of Weighted Arithmetic Mean (WAM) of the area cluster = ∑(A% x W x Y) /Y where Y is the total built up area of residential area.
f)Maximum Demand Estimation
Maximum demand for each load cluster is determined by applying hourly diversified factor to the Watt/Sq.m arrived by means of WAM. Hourly diversity factor varies with time, application and climate.
Hourly Max Demand (MW) = Watt/Sq.m x BUA (Built Up Area) x hourly group diversity factor.
Thus, the maximum demand of the city is derived from the peak demand of the hourly demand curve. A typical hourly energy demand curve is shown in Figure 5.
Power Distribution
The distribution network is the most extensive part of electrical power supply system, therefore optimization plays a vital role in the distribution system design. General design criteria include:
- Statutory rules applicable for particular location
• Power reliability and redundancy
• Minimum T & D losses
• Optimal selection of incoming power supply voltage level
• Optimal selection and close proximity location of distribution equipment
• Optimal sizing of main transformers and other distribution transformers
• Implementation of integrated and efficient automation system for the complete power distribution system
• Quick fault isolation and restoration
• Security and safety
To meet the aforementioned criteria and to design an optimized power distribution system,bottom up nodal methodology is adopted.
Figure 6 in next page indicates the different stages involved in a bottom up nodal methodology.
Normally, the plot level feed points will be allocated based on the kVA versus voltage level identified by respective statutory norms. Based on the above criteria, the total no. of LV and HV customer feed points is arrived at for each voltage level. Grouping of individual plot level feed nodes (LV nodes and HV nodes) and formation of distribution substation loops based on zoning philosophy i.e., grouping within load clusters and particular type of land like residential, commercial, etc. is performed based on the circuit loop kVA limitation imposed. Point to be noted is, grouping should be within close proximity and meeting the voltage drop limit criteria. Further grouping of various load clusters is done and this grouping will be based on the limitation of HV equipment capacity.
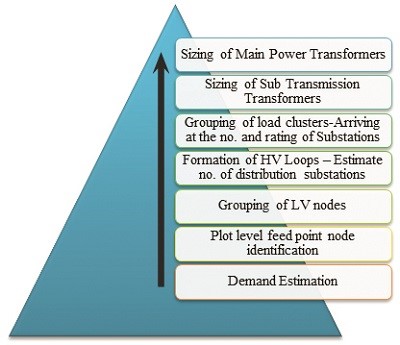
Figure 6: Stages Involved in a Bottom up Nodal Methodology
In the design of main transformer and other intermediate step down transformers, key point to be noted are is ensuring continuity of power supply till end customer. Thus, redundant or n+1 transformer design is normally considered. As these transformers loading varies with time and climatic factors, optimum loading factor and diversity factor are chosen such that transformer is neither overloaded during peak utilization nor under loaded during off peak conditions and transformer losses are kept minimal.
Continuity of supply is achieved by means of Ring Main Units (RMU) looped to form a ring network. Ring network is designed with self-healing technology, which is achieved through fault passage indicators and auto sectionalisers for quick identification of fault and restoration of supply.
Selection of incoming voltage level and other intermediate voltages play a significant aspect in the design which influences the distribution network topology. Incoming voltage levels are normally selected based on the total demand requirement, and proximity of the source substations.
Power Distribution Automation
In order to achieve energy efficient power supply system with high quality and reliability, real time centralized control and monitoring is of paramount importance. They are met by means of integrated and intelligent power distribution automation. Thus, following automation facilities are provided for the power distribution of the city:
- Main receiving substation automation through IEC 61850 compatible SCADA system
• Sub transmission substation automation by means of micro SCADA with IEC 61850 compatibility
• Distribution automation through fault passage indicators, self healing system and smart RTUs
• LV distribution automation through smart panels
• Utility automation through intelligent MCCs and smart panels
• Home automation through Automated Metering Infrastructure (AMI)
• Smart lighting controls.
Conclusion
Development of Smart Cities is an ambitious plan rolled out by the Indian Government with an aim to improve the quality of life of people and improve the growth of the nation.
To fulfill the smart city mission, the key challenge for power providers/distributors would be to create a balance between the supply and demand of electric power. Robust demand estimation techniques, efficient power distribution system with energy efficient technologies are essential for implementing an economical and stable power supply system in smart cities.

If you want to share thoughts or feedback then please leave a comment below.