From the time the seeds of industrialization were sowed with the advent of the industrial revolution, the demand for fossil fuels to power factories and manufacturing units is only increasing. Extensive exploitation of the energy resources and an endless increase in demand for power has caused depletion of resources and hike in power tariff. As the criticality of the situation demands, industries have found it beneficial to deploy energy monitoring systems that aim to maximise power savings. In these systems, a database of electrical data is created. Power wastage can be minimised by closely analyzing the monitored electrical data and implementing a corrective plan of action. This will not only help cut down on hefty electricity bills for industries, but more importantly, promise a better, greener future.
In India, much attention is being given to the energy sector. India has limited fossil fuel reserves, which are depleting at a rapid pace. Taking into account the current reserves to production ratio, India’s oil and natural gas may last for less than 20 years, while the coal reserves may last for about 200 years. It is the need of the hour to utilise these precious resources efficiently and to minimise their wastage. Energy monitoring and management system are deployed in industries to ensure energy efficient operations and consumption.
Many such energy monitoring and management systems have been developed over the years for industries as well as for homes. Energy management systems based on ZigBee, IEC 61970 and IEC 61850 international standards, PLC etc. have been proposed, to name a few.
A simple energy monitoring system discussed here has the capability to acquire data from a three-phase supply network, store the acquired data in a relational database and to display the data from the database in the form of reports and trends. It acquires data from the supply using a power measurement module. The power measurement module measures electrical data in a three-phase supply network. The three-phase voltages and currents are fed as inputs to the power measurement module. Based on these input values, total power factor, total active energy and frequencies of the three phases are calculated.
The Programmable Logic Controller (PLC) is programmed to acquire the electrical data from a remote station (where the PLC-based system is installed). The acquired data is stored in a relational database. Modbus TCP communication is used to retrieve live data from the remote station. A Supervisory Control and Data Acquisition system is conceptualised and developed. It has the capability to generate reports and trends of the data recorded in the relational database. Any wastage of energy can be sensed and corrective action can be taken by monitoring the recorded data.
Hardware Requirement
The energy monitoring system aims to create a relational database. The main hardware used in the energy monitoring system is listed below:
- PLC (Ethernet Programmable field bus Controller): to acquire electrical data from a three-phase supply network and log the data in the database. A Programmable Logic Controller (PLC) is a digital computer which is used to read inputs from input devices, process the input values based on certain logic, and writes output in the output devices. The logic is programmed in PLCs through PLC programming software. Live data of the three-phase supply is obtained through Modbus TCP communication.
- Power Measurement Module: to measure electrical data in the three-phase supply network. Based on the measured current and voltage values, other electrical values are calculated.
- Ethernet Cable: for communication between the PLC and the PC.
- Current Transformers: to step-down the three-phase current supply to be safely applied to the power measurement module.
- End Module: to complete the internal circuitry for proper termination of the module assembly.
- Power supply unit for controller & modules
- MCBs, terminal blocks, DIN rails and panel box
The system is fitted in a panel box, which has two rails attached to it. The controller, power measurement module, end module, power supply unit for the controller and modules, MCBs (Havel’s switches) and terminal blocks are mounted on one DIN Rail. Terminal blocks are mounted on the other DIN rail.
The relational database of the electrical data is created in SQL Server. A Supervisory Control and Data Acquisition (SCADA) system is a communication and control system used for monitoring, operation and maintenance of energy infrastructure grids. The SCADA is conceptualised and developed in Visual Studio. It has the capability to allow the user to filter data between two dates and to generate graphs of the data. In this article, the electrical data is acquired by the PLC in every 20ms. The SCADA system displays the data in the form of graphs and reports.
The current and voltage connections of the three-phase supply from the LT-2 Panel are made to the power measurement module channels. As the current values of the three-phase supply is too high to be directly applied to the power measurement module, current transformers (CTs) of turns ratio 400:5 are inserted between the LT-2 Panel and the power measurement module to step down the currents to a value which can be safely applied to the module. The maximum current that the module can measure is 5A.
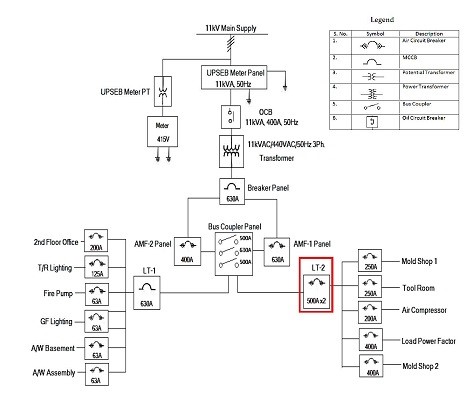
Fig 1: One-line diagram of the electrical distribution system…
Automation System Architecture
Fig. 2 shows the automation system architecture of the energy monitoring system. The architecture depicts how the various components of the proposed system are connected. Wire connections are made from the LT-2 panel to the power measurement module. The 3-phase power measurement module takes the three-phase voltages and currents as inputs from the LT-2 Panel.
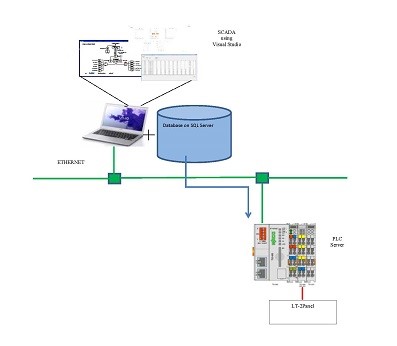
Fig 2: Automation Configuration…
Based on these input values, total power factor, total active energy and frequencies of the three phases are calculated by the module. The power measurement module uses 6 analog/digital converters for acquisition of the current and voltage levels in all three phases.
The power measurement module is connected to the PLC and transfers the measured data to the PLC via data contacts. The PLC communicates with the PC via Ethernet. The PLC is programmed to periodically transfer the measured data to the relational database. PLC programming is done in the software used to program PLCs. The last byte of the IP address of the PLC is manually set using the DIP switch present in the PLC. The values measured are logged in the database after every 20ms. The electrical data logged in the database is as follows:
- Voltage, Current and Frequency of Phase-L1
- Voltage, Current and Frequency of Phase-L2
- Voltage, Current and Frequency of Phase-L3
- Total Power Factor
- Total Active Energy
The relational database for the system is created in Microsoft SQL Server 2012. For the database, a table is created in which every variable is assigned a column. The data is logged into the table row wise by the logic written in programming software to connect to the SQL server database and move the data to the database table. The data recorded and reported by the energy monitoring system includes the three-phase voltages, currents and frequencies, total power factor and total active energy.

Reporting the Data
The database created in the SQL server is linked to self-conceptualised and developed SCADA in Visual Studio software. The SCADA is linked to the relational database in which the electrical data from the PLC is stored. The SCADA displays the data in user-friendly, easy-to-understand form, in order to help operators analyse the power data quickly. It has been proved that an effective SCADA system can save significant amount of time and money.
The proposed SCADA system can display the data that is logged in the relational database in a graphical form. The representation of power data in graphical form eases its study and analysis as well as any discrepancies in the values can be easily noticed.
It also displays the data in a tabular form. Data can also be searched for a single day or between two dates. It provides the operator with the facility to filter data of a specific day or days for a focused study.
The SCADA system also has the ability to display the live electrical values. This is possible with the help of Modbus TCP communication. For Modbus TCP communication with Visual Studio software, a communication related library file is required. MBT.dll has been used, which has inbuilt commands for Modbus TCP communication.
Conclusion
Energy monitoring systems are an effort to contribute to energy conservation. It ensures energy efficient operations in industries, and thus strives to create an energy efficient environment.
The energy monitoring system discussed here fetches data from the three-phase supply network through Ethernet and Modbus TCP communication. The system logs the measured and calculated electrical data in a relational database, creating a record of the data for analysis.
The SCADA developed allows the operator to view the logged data in a graphical form. It also allows data to be viewed in tabular form and to search data between two dates.
The data logged can be viewed and analysed to take measures to save power and minimise its wastage. The logged data also gives an idea of the load distribution in the three phases of the supply. Any sudden changes in power values at any point in time, is also recorded.

If you want to share thoughts or feedback on this article, please leave a comment below.