There are two major focus areas for Instrumentation And Control Systems (ICS) for Thermal Power Plants (TPS): Power block [boiler, turbine, generator (BTG) and associated auxiliaries] ICS for achieving generation and ICS for BOP (Balance Of Plant- the outlying auxiliaries) for providing the support. Traditionally, the focus of instrumentation and controls has been on the power block with the primary aim of achieving good generation. In the BOP areas, there is alow level of automation and instrumentation. This article identifies areas where installation of instrumentation and controls can bring about energy efficiency, safety and cost reduction in the primary cost components of a coal fired thermal station, viz., coal, fuel oil, water and auxiliary power.
Primary sensing, data acquisition and storage systems, data highways, data base creation and software for totalization, secondary computations based on primary data, flexible report generation functions are essential for efficient plant operation in the following areas:
i. Coal measurement and management systems
ii. Oil measurement and monitoring systems
iii. DM water measurement and monitoring system
iv. Auxiliary power
v. Station heat rate
Linking of the above to the plant operating parameters to calculate online indices or porting of plant operating parameters to these software is essential for efficient operation of the plant and cost control. There are technology gap in the above areas. ERP (enterprise resource planning) packages normally address inventory, knowledge, procurement, spares, maintenance and operational management and do not cover primary input tracking. Continuous and constant monitoring and control of fuel consumption, water consumption and auxiliary is essential for achieving cost effective power generation.
Introduction
The major investment into coal plant ICS and condition monitoring is for the power block and electrical controls and their associated auxiliaries with an aim of achieving good energy generation (units generated in a given time slot and the unit loadability). Generation has always had precedence over energy efficiency, safety and cost considerations. The areas of outlying auxiliaries and inputs that go into the thermal power plants are audited through instrumentation of the analog type with human intervention. This was because the primary sensing technologies were not available and technology of data acquisition and data transfer were not cost economical for either on-line or off-line monitoring. The technology developments in the areas of sensors, computing and communication now enable cost effective solutions. The existing scenario therefore needs intervention through improvements in monitoring and controls of primary inputs that go into a coal fired plant.
The concept of stand alone measurement grids/hubs through DAS (data acquisition systems) need to be implemented for the primary inputs, coal, fuel oil, water and auxiliary power. The stations must prefer Intelligent Electronic Devices (IEDs) over analog stand alone measuring equipment, which cannot be seamlessly integrated into a central server and which have provision for downloading data into a data base.
Also, the concept of separate and independent receipt and consumption measurements would help in tracking of losses in the system. In most cases a single measurement represents both the receipt and consumption.
Presently the station coal measurement at the TPS is mainly at the coal handling plant and the station as a whole is responsible for the overall coal receipt and consumption. The responsibility for accounting and tracking of coal consumption is not vested with any particular group such as Coal Plant Group, Fuel Logistics Group or Operations Group. For more effective management, the sharing of responsibility of coal consumption in the plant could be based on the jurisdiction of the various technical groups and can be as follows:
Coal weight and coal GCV between the coal mine and the entrance of the CHP of the TPS: Fuel Logistics Group which liaisons with the mines and the railways, etc.
Coal weight and coal GCV drop between Coal Handling Plant and the bunker: Coal handling Plant Group which receives handles and conveys the coal to the bunkers. It will be the responsibility of the coal handling plant to account for coal weight and coal GCV drop between receipt point and the bunkers.
Beyond the bunker: Once the coal enters the bunkers and the mills, the Operations Group must take the responsibility to control and minimise the coal consumption.
To implement the above, the instrumentation and control set up is to be developed to get a break up of the quantities at each level of the plant.
Technologies for determination and control of transit losses for operating cost reduction
The technology of computing transit loss in many of the stations is obsolete and involves analog outdated machinery and manual recording at several places and also double recording resulting in wastage of manpower for recording purposes when it can easily be automated. Manual intervention increases chances of errors which are difficult to track and reconcile. Presently, the time constant to compute and realise the magnitude of the transit loss takes around 3-5 days.
The technology of the pit type weigh bridges is obsolete and involves manual recording of analog signals. Printout in the form a dot matrix printer is also obsolete. Human intervention is inevitable in the measurement process. Though the accuracy is adequate the overall uncertainty is depending on the reliability indices of average interruption frequency and duration indices on an annual basis. Since the disposal rate of a rake is 4-8 hours, an outage of the weigh bridge for 1 day will lead to an uncertainty of 3 rakes.
The power stations would benefit by going in for technology up gradation in this critical area of their operation. Global positioning system technology for precisely mapping and tracking the movement of the trains for effective tracing the origin and location of the transit loss is an appropriate solution. Rail tracking system through GPS or alternative technologies needs to be adopted.
Rail signature system at the sending end and receiving end are also essential to ensure that there is no tampering. Rail signature systems are usually installed at the entrance to the coal yard at the tippler hopper area.
The Wheel Impact Load Detector (WILD) developed under RDSO research initiative can integrate rail signature as well as wagon weighment at speeds in the range of 0-150 km/h in one system. Besides weighing of primary resources, viz., coal, accurately, the transit losses can be reduced by effective tracking of wagons from their source mine to their destination (power house coal yard). It is recommended to go in for fully automatic pitless in-motion weigh bridges (where the entire rake is measured at a speed of 10-150 km/h). Figure 1 & 2 show view of in-motion weigh bridge.
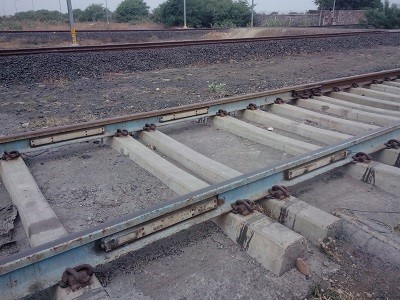
Figure 1: View of location of in motion weigh bridge on railway tracks…
The high speed in-motion weigh bridge should have an electronic digital interface to digital data transfer to a central server/data highway through communication media both at the sending and receiving end. The in-motion bridges would be required for gross weight and for tare weight at both sending and receiving ends. At a central server the data from the motion bridges can be downloaded into a data base – from which it can be used to calculate a variety of information automatically without any human requirements of feeding in data.
Technologies and models for station & unit coal measurement (coal receipt & consumption measurement)
Since the weigh bridges are analog in design with open loop communication, human intervention is required and hence fully automated pitless in motion weigh bridges with digital interface and provision for data communication to a central server or receiver control room is recommended. These must act as Intelligent Electronic Devices (IEDs) and seamlessly communicate with the overall plant automation. Besides, fully automatic rail signature at the receiving end is also recommended with provision for acting as IEDs to communicate with the plant automation.
The periodicity of coal inventory measurement is once in 10-30 days depending on the station practices. The inventory accounts for coal present in the coal yard and is used as a basis for working out the coal consumption in the units and in the station.
Traditionally, the coal consumption was estimated by apportioning on the basis of units generated and specific coal consumption (kg of coal per kWh generated). Unit bunkers were filled based on the need – and the coal consumption was not being measured because of non availability of instrumentation for both coal quantity as well as bunker level indication. Many of the stations are not having complete gravimetric feeder set up on any Unit with provision for coal flow measurement. The quantum of consumption is not known accurately.
In the absence of coal measurements to individual units, it is not possible to know the specific fuel consumption which is the basis for the heat consumption of the unit. The presently used system in many of the stations is highly inadequate and not sufficiently sensitive to unit performance. Hence, the estimated specific coal consumption does not reflect on the realistic coal consumption of any particular unit in question. The coal entry into the boilers of each unit needs to be measured. At present technologies for on-line or off-line coal monitoring of unit coal consumption are available and are also in use in a few of the stations.
An online process (without any human intervention) which would give the on-line coal consumption with uncertainties of 1.0% is feasible and the technology for the same is well proven and established. The conventional stacking method can be used for reconciliation of data/cross verification only and not for coal consumption measurement.

Figure 2: View of recorder of in-motion weigh bridge…
The use of fully automated, tamper proof modern instrumentation free of human intervention for on-line coal inflow and consumption needs to be used. Based on an assessment of the different technologies the following are recommended in the Indian scenario:
- Installation of belt weighersfor all coal conveyors. The belt weighers alone do not give unit specific coal measurement which is essential for accounting purposes. The belt weighers give weight of coal moving through it between any two time intervals. The arrangement for unit wise coal consumption is essential. This is possible by providing a system of monitoring the time elapsed by a belt over a given bunker and which involves integration of the output of the belt weighers over the total bunkers of a given unit in a given period of time. A viable and innovative scheme for monitoring the bunker wise coal from the belt weigher data is possible through time wise integration of belt weigher data and totalization in separate data bases assigned for each of the bunkers.
ii. Coal level in the bunker is presently recorded manually which is obsolete and does not give quantitative data on the bunker level. Further it gives data only when the persons inspect it and does not give the exact height of the coal stack. The height of the coal stack is generally not uniform and is measured through a string. Microwave or Ultrasonic bunker level monitoring system with digital data output, communication of data to central server or control room is required.
iii. In addition to belt weighers, coal flow into the units needs to be monitored by gravimetric feeders (in each mill) which provide accurate and authentic coal flow measurements. This is to provide a redundancy in the measurement. The differences in the two are to be reconciled to be within 0.5%. At present, there are several types of reliable gravimetric feeders available and any reliable feeder can be installed.
iv. DAS &Software is to be in place for integrated online coal energy management in the plant. The software inputs data from the various field instruments for coal receipt into the station from various sources (such as wagon tippler, track hoppers, ropeways, trucks, conveyors, bucket elevators etc.) and coal consumption at various bunkers. This software must also compute the coal consumption, heat consumption, heat rate, etc., at various points, on line. The DAS software and hardware are to form a self centered grid/hub for coal management with open architecture and seamless interface with other DAS/DCS.
v. Computation of unit coal consumption. This is purely from the reading of the belt weighers and bunker monitoring system. This coal consumption is to be used for computation of unit and station heat rate for normal and cycling operations as per international practices.
vi. Computation of stacking loss. This is the difference between the total online receiving end coal consumption and the total on line bunker wise coal consumption of each unit. If all weighing instruments are fully automated IEDs, the on line stacking loss can be computed.
vii. Computation of coal inventory over a time period of month, quarter and year is through stockpile contour profiling software based solution such as Total Station, etc. for more accurate stock pile measurement. The bulk density of coal (kg/m3) needs to be physically determined for crushed and uncrushed coals as well as coals of different varieties and weighted average needs to be taken rather than one single value for the entire stockpile.
In all above instruments to be fixed the following must be observed:
- The instruments must function as Intelligent Electronic Devices (IEDs) by digitally communicating with a central server or control room through downloading of data continuously. The data from each of the sensors must be downloadable into a data base format from which it must be compatible with other data for on-line calculations.
• The instruments must have provisions for communication of digital data.
• The instruments and the digital conversion systems must have a very high reliability in terms of 0.5 interruptions per year and 4 hours per year.
• The integrated coal DAS must be of open architecture.
By this process the coal consumption will depend on the unit performance and not vice versa. The other advantages are:
• The process is fully automatic and does not involve human intervention
• The process is closed loop without scope for errors from extraneous sources.
• Stone picking, tippling and weighment need not be coupled and these can be independent activities.
• The measurement will be available on line to all concerned and avoids 10 days time delays for each settlement slot of coal consumption.
• Wireless data communication can be adopted.
All the above technologies are proven and in use in many power stations across the country.
Technologies for measurement and computation of average heating value of coal
The heating value determines the coal consumption. The measurement of GCV is as important as the coal quantity measurement as it directly affects the coal consumption and generation cost on account of coal.
In the TPS context three heating values are of importance:
- GCV (dispatch end): Gross heating value -a commercial heating value for payment purposes.
ii. GCV: Gross heating value of the received coal sampled at the point of unloading.
iii. GCV: Gross heating value of the coal fed into the boiler and sampled either at the conveyor belt to the bunker or at the coal feeder.
Accordingly, the heating value of coal is determined for the following three cases:
- GCV (sending end coal) (kcal/kg) of Coal dispatched from collieries:rake wise, colliery wise, weekly and month wise data.
ii. GCV (receipt coal) (kcal/kg) of Coal received from collieries: rake wise, colliery wise, weekly and month wise data.
iii. GCV (fired coal) (kcal/kg) of Coal being used in the units: shift wise, unit wise, stage wise and month wise data
While receipt coal is sampled on the basis of mine, rake, truck, ropeway, etc., the fired coal is sampled on the unit wise basis. Earlier practice was to determine only sending end GCV and bunkered coal GCV as the receipt GCV data was not directly used in any calculation. Presently, the stations are determining the GCV of receipt coal as well as GCV of fired coal, in addition to the sending end GCV.
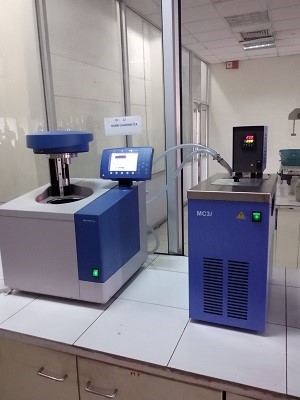
Figure 3: View of a bomb calorimeter…
Heating value determination: In many cases, the GCV is determined by proximate analysis. The GCV of sending end, receipt coal as well as bunkered coal is being determined by proximate analysis or by a bomb calorimeter. All GCVs need to be determined only by a bomb calorimeter and never through proximate analysis (Figure 3).
For further refinement in the heat value determination, sample to sample variation in a rake (for receiving end coal) for each rake and to measure in-sample variation to select the minimum sample size. This data can be used to authenticate the GCV values determined.
Averaging schemes for monthly GCV (dispatch coal and receipt coal): The averaging of the GHV (dispatch) and GCV (receipt) is based on weighted average of each independent consignment received at the TPS through EXCEL. The software for auditing of the quantities and individual heating values calls for a data base for compilation of the monthly average values between pre-defined points of time. The data base is required for establishing the correctness of the monthly average values as well as archiving of the data over a period of time.
Averaging schemes for monthly GCV (bunkered coal): The monthly value of GCV which is a single point GCV is obtained from mixing all monthly samples and determining the GCV through a bomb calorimeter. In addition to the above, the GCV of daily sample is also determined and the weighted average value of the daily GCV is taken to determine the monthly GCV. The GCV of the average value is reported and the mix sample is used for tallying. The monthly average bunkered coal GCV is the basis for declaring the GCV, which goes for cost calculations and which is used for computing the SHR (Station Heat Rate).
Receipt coal sampling: Manual sampling is being resorted to in many stations where there is no automatic sampling. Change over to mechanised auger sampling must be done at the earliest. The automatic vehicle mounted auger may be used extensively in all stations for all receipt coal as it will help in taking out coal samples up to a depth of nearly 2m from the top of the wagon. In manual sampling, only top coal is removed and the internal coal is not sampled.
Bunkered coal sampling: To minimise sample to sample variations in coal quality, use of automatic samplers is suggested for bunkered coal. Further it is quite cost effective in comparison to manual sampling which is a time consuming process.
Automatic samplers for collection of bunkered coal samples are as follows:
Sampling from static heaps such as bunkers:
- Auger
• Sampling shovel
• Automatically operated bucket moving with uniform speed into the falling coal stream at adjustable intervals of time
Sampling from falling stream such as feeders:
- Breeches chute type sampler
• Swinging arm type sampler
• Chain bucket type sampler
Sampling from moving conveyor belts:
• Sweeping scrapper arm
Automatic buckets and swing arms are good for coals with wide ranging size distribution.
Sample preparation: For the sample preparation process, primary & secondary sample crushers and sample pulverizes are required to be constantly repaired to ensure that the grinding surfaces are intact and not eroded to provide the sizes stipulated in the standards.
GCV data management: The GCV values are being recorded into a register without back up of computer print out to authenticate the recorded data. The GCV values are being recorded into the register with human control loop leaving scope for errors. The process needs to be made more transparent and authentic. The process of entry of the data from the bomb calorimeter into the register needs to be automated and authenticated by back up data either from a print out of the memory of the bomb calorimeter or print out of each value.
Coal characteristics as operational aids: Equipment for TGA analysis of the coal may be introduced. The equipment must be fully automatic with provision for transmission of the results (TGA traces) to a central server or control room from where the different groups can view it. The combustion characteristics are not dependent on the GCV alone but on the percentage of volatiles. If the volatiles are too low in the coal then even though GCV is high its combustion characteristics are affected. This information can also be used to ascertain that the flame temperature is appropriate for a given coal. This analysis must be done before the coal goes to the bunker so that the operator is well aware of the combustion characteristic during the shift. It is clarified here that obtaining a TGA after the combustion is over is only of academic interest and does not provide the operator with any inputs for operational optimisation. This will be useful when there is over 3 days coal stocks.
Ultimate analysis (elemental analysis) mapping of coal from different mines and sources is essential at least once a month instead of biannually or annually in many stations through a carbon, hydrogen, nitrogen (CHN) apparatus. This is useful for process optimization of boiler efficiency. At present ultimate analysis is not finding much use in operational optimisation in many stations. This is an essential requirement for optimisation of heat rate as it is used for computing the flows and losses in the boiler.
Technologies and models for measurement of fuel oil (receipt and consumption monitoring)
Fuel oil refers to basically Furnace Oil (FO) and Light Diesel Oil (LDO). In the present energy context considering that oil is a scarce resource, the instrumentation for measurement of oil receipt and consumption is inadequate in many of the stations. Oil consumption in individual units is not available to a pre-designed accuracy level based on individual gun hours. Though the total consumption of oil is known reasonable, the individual unit wise consumption required for energy control is not known accurately as this is apportioned based on gun hours considering equal flow of oil in each gun. Moreover, the oil measurement involves human intervention through manual recording of levels.
Oil receipt measurement: Pitless in-motion weighbridge is recommended for measurement of oil in tankers. Fully automatic ultrasonic level indicators with provision for conversion of signals into digital signals and communication through a media to central server or processor could be considered for installation for all oil tanks. The digital signals must be downloadable into a data base on a continuous basis. A fueloil monitoring software package with DAS hardware is to be in place for on line calculation and logging of the oil receipts, etc.
Oil consumption measurement: The present method of oil measurement in many of the stations is based on manual log reading of the on-off timing of the oil guns multiplied by a constant gun oil consumption. Alternatively pump hours are also taken as a basis for measuring oil consumption between two time intervals. Fully automatic differential pressure orifice plate or nozzle type or mass based oil flow meters with provision for continuous digital data transfer would be useful for all units for monitoring oil consumption. Continuous logging of oil indicator levels can also be used for oil consumption monitoring (Figure 4).

Figure 4: View of level indicator for fuel oil…
The oil gun on-off operation data must be recorded through a time based system automatically to give a time trace of when the guns are on and when the guns are not in service. This will be useful for performance optimization group to study the operator to operator variations, coal to coal variations, variation in different seasons, etc. Solenoid valve based on-off monitoring of gun time may be introduced. This is not much useful for oil consumption monitoring.
Integrated fuel oil receipt and consumption monitoring: A fueloil monitoring DAS & software package is to be in place. When digital ultrasonic level data of tanks, digital individual unit wise oil flow data, individual gun hours data, GCV of oil, etc., are available on line, the software package must calculate the oil receipts, oil consumption, shift wise, unit wise oil consumption, specific oil consumption, time trace of guns, oil consumption during cycling operations, heat consumption due to oil usage, contribution to heat rate, etc.
Technologies and models for measurement of DM water and associated water systems
The power generation process involves production, storage, transfer and measurement of DM (De-Mineralized) water, soft water, raw water and drinking water- production, consumption and flow. DM, Soft water, raw water and drinking water all need to be measured and audited for overall water balance on line and in real time and must not be assumed values.
In many of the stations, the flow instrumentation in the entire DM plant is not adequate. Separate consumption and production measurements are not available. Online monitoring of DM water flow is available and unit make-up with integrators are essential to control the energy efficiency as the make-up is directly proportional to the steam lost from the system and affects the unit heat consumption and heat rate. Fully automatic on-line measurement of water consumption for both production and consumption measurement of raw water, DM water, soft water and drinking water is required for auditing and conserving the water consumption and reducing the water related costs of generation.
Both DM water production and consumption must be separately measured and audited. In the absence of separate measurements, it is normally construed that all production is utilized and hidden losses are not identified.
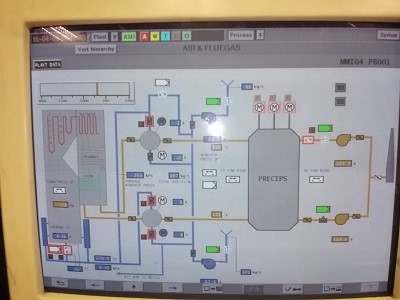
Figure 5: View of console a typical control panel in a coal power plant…
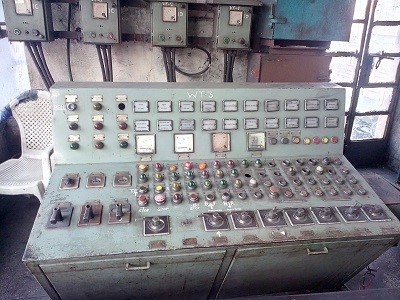
Figure 6: Older design of control panel of a coal handling plant in a power station…
Installation of fully automatic differential pressure orifice plate or nozzle type flow meters with digital output, communication media to relay the data to a central server or the DM control room computer and provision for downloading the data into a data base for on line monitoring of make up especially during cycling operations is essential for auditing water consumption. During cycling operations such as warm, hot or cold starts considerable amounts of steam is lost and has to be replenished. On line monitoring of DM water would help in control of unit heat rate as well as give an accurate account of the chemicals consumed for DM water production.
Integrated water monitoring DAS & software package: The package must have capability to draw inputs from the various field instruments (which will act like IEDs) and make an on-line continuous data base grid of the information for generation various types of information such as consumption per unit per shift, consumption during cycling operations, operator wise consumption, etc., to enable the performance optimisation group to take control action on the areas of wastage and excessive consumption. Consumption and production should be separately monitored. At present only gross data is being recorded and is not useful for energy control.
Technologies and models for measurement of auxiliary power
The auxiliary power is computed off-line at many of the power plants by collecting energy meter readings by 24 hours interval at control room. At present the power stations are computing the auxiliary power by the following procedure:
- The gross energy generation is computed by taking the generator energy meter readings.
ii. The in-house auxiliary power is computed by taking the energy meter readings of UAT (Unit Auxiliary Transformer) bus.
iii. The station auxiliary power is computed by taking the summation of energy consumption of station transformers and proportioned for individual units based on its gross energy generation.
In many stations, the CTs and PTs are of low accuracy class even though metering is of 0.2 class. Hence, all the CTs and PTs at plant and Generation Control Room (GCR) must be of 0.2% accuracy class for energy billing. For all HT auxiliaries their power output should be recorded through sensors (3 voltages, 3 currents and 3 phase angles) and specific energy consumption should be indicated for process optimisation. Adoption of single phase data is neither accurate nor diagnostic.
Integrated DAS & Software for auxiliary power: Automatic data logging of generated and auxiliary power is required for evaluation of energy consumption and its use pattern. Typically energy management systems are useful. Figure 5 shows the console of a typical control panel as compared to older control panels (Figure 6).
Technologies and models for measuring station heat rate
Many individual units in stations (almost 60-70%) are not having an up to date heat rate evaluation package or a performance evaluation modules. OEM (Original Equipment Manufacturer) supplied package is in use for some units but not adequate if these packages are supplied long back.
Installation of on line heat rate monitoring packages is essential for each and every unit of the TPS. These packages need to be utilised for heat rate computation for turbine heat rate computation while boiler efficiency is calculated from indirect method. On-line unit heat rate packages may be installed for units that do not have it. From the combined output of the online heat rate of individual units, the on-line capacity weighted average Station Heat Rate (SHR) may be computed. Offline standard heat rate package may be procured for SHR.
It is essential to go in for actual measurement of heat rate based on instrumented on line monitoring of coal and oil, which enter the unit and the energy generated from these. It is essential to link the units generated to measured quantities of coal and oil within accuracy bands which are pre-fixed and maintained. The reliability of instruments is required in the order of 0.5 interruptions per year and of 4 hours per year.
Plant instrumentation & controls
Some of the areas for improvement are as follows:
- Many units do not have a Distributed Control System (DCS) and rely on analog control systems with no data storage and no data transfer capability. Introduction/up gradation of data highway and data storage to modernise the C&I system is essential.Upgradation of the data acquisition, storage and data high ways along with specialised or customised software is essential for transparent, efficient operation and maintenance of the power plants to meet its objectives through network and internal integration of data.
ii. O2 measurement may be introduced after APH at the ID fan discharge. This will give the APH in-leakage. The O2 measurement may be on the basis of forming a grid of a minimum of 3 sensors in one duct. This will help in providing the representative O2 levels.
iii. On-line CO measurement is presently not reliable. Off line CO measurement is now need based. Continuous monitoring of CO before APH may be introduced for combustion optimisation.
iv. Introduction of fire ball visualisation through infrared/acoustic/optical pyrometry or Visual systems through CCTVs with filters.
v. Furnace Exit Gas Temperature monitoring system (FEGT) with HVT (High Velocity Traversing air cooled probes) using acoustic pyrometry/infrared thermometery/radiation pyrometry/visible CCTV with filters.
vi. On-line condition monitoring through on-line vibration measurement of major HT auxiliaries like ID fan, etc.
vii. Variable pressure operation and sliding pressure operation to be used.
viii. Replacement of AVR (Automatic Voltage Regulator) by digital voltage regulator (DVR) for units which do not have these.
ix. Electromechanical relays for generator protection may be replaced by group solid state numerical relays.
Conclusions
The main conclusions of the study are as follows:
- Cost control of components affecting generating cost like fuel, water and auxiliary power is possible through auditing, monitoring and constant control which is possible only through a strong instrumentation and control system.
ii. Measurement of important parameters which affect the input costs like coal, oil, water need to measured and not estimated.
iii. Both receipt and consumption need to be separately monitored, reported and reconciled through computerised Data Acquisition System (DAS) in respect of coal, fuel oil, water flows through the plant.
iv. There must not be human intervention in the measurement, recording, averaging and compiling quantities of coal, fuel oil and water resources which affect the station input costs.
v. Transit loss, specific fuel consumption and GCV are interlinked and realistic quantification of these will only be possible if an integrated automatic fuel monitoring DAS hub is in place.
vi. Measurements and data grids are required for the following areas:
→Coal (imported, raw & washed):Measuring of in-motion railway wagons, ropeways, conveyors, bunker levels and coal fed into each unit.
→ Fuel Oil (LDO & FO): Overall of each unit and station.
→ DM water: DM water production and consumption in each unit.
→ Raw water, soft water and drinking water: Consumption in various locations including intake.
→ Auxiliary power (UAT & ST): The measurement of individual equipment power is required.
→ The measurements of these parameters are not enough. Totalisation and data handling to compute receipts and unit consumption on-line, daily and monthly and yearly are required. Mere installation of instruments at the key points will only give stage-wise consumption but not unit wise consumption. For energy monitoring, unit wise consumption is essential. The instruments must have features for recording unit wise consumption by time totalisation into multiple data bases. Also, these equipment must be of the continuous recording type with digital interface and provision for totalisation over the year. Further these instruments must have high reliability.

If you want to share any thoughts or feedback then please leave a comment below.